If you have ever spent three hours building an SEO report only to get back a one-line reply from a client saying "looks good, thanks," something went wrong. Not with your SEO. With your report.
Most SEO reports are either bloated with numbers that mean nothing to the person reading them, or too thin to justify the budget being spent. Neither version builds trust. Neither version gets clients to say yes to the next campaign phase.
The good news? Fixing your SEO reporting process does not require a tool upgrade or a design overhaul. It requires understanding which metrics actually move business decisions and how to tell that story clearly.
This guide is for in-house marketers, agency teams, and anyone working with a Digital Marketing Agency or SEO Company in India that needs to show real results in a way that clients can understand and act on. We will cover what to track, what to drop, and how to present it all without putting anyone to sleep.
Why Most SEO Reports Fail Before They Are Even Read?
Here is a hard truth: a lot of SEO reports are built for the person writing them, not the person reading them.
They are full of DA scores, crawl error counts, and keyword position averages. These numbers feel important to an SEO professional. To a business owner or a marketing director, they are close to meaningless. That gap in understanding is where most reporting fails.
According to research by AgencyAnalytics, 65% of marketing agencies create SEO reports for their clients on a monthly basis. That is a lot of reports going out every month. Yet, the majority of them either overwhelm the reader or fail to tie results back to business goals.
The fix is not simpler design. The fix is asking better questions before you build the report. What does this client actually care about? What does success look like for their business? Is it more phone calls, more product sales, more demo requests? Once you know that, you build the report around that answer.
The best practice is to include no more than 9 metrics in your report. Anything more than that can overwhelm the client and leave them confused.
So before we get into which metrics to track, let us agree on one principle: every number in your SEO report should connect to a business outcome. If it does not, cut it.
The Case for Taking SEO Reporting Seriously
Let's start with the "why" before the "how."
Over 53% of all website traffic comes from organic search, confirming that SEO is the most effective channel for online visibility and engagement. That alone should make the case for consistent, clear reporting.
But there is more. SEO drives over 1,000% more traffic than organic social media. And from an ROI standpoint, B2B SaaS SEO delivers a 702% average ROI over 3 years, while Financial Services SEO delivers a 1,031% average ROI over 3 years.
These are not just numbers to impress a client. These are the numbers that explain why every business, whether running their own SEO services or working with an agency, needs a proper way to track and communicate what is working.
When your reporting is clear, clients stay longer. When they can see progress tied to their goals, they invest more. When you show them ROI they can explain to their own bosses, you become an irreplaceable partner.
Part 1: Metrics That Actually Matter in SEO Reporting
There are dozens of SEO metrics available. Here are the ones that hold real weight.
1. Organic Traffic (By Channel, Not Just Total)
This is the starting point for any SEO report. Organic traffic tells you how many people are finding your website through unpaid search results. But do not just report the total number. Break it down.
Look at which pages are driving traffic. Look at whether that traffic is trending up or down over a 3-month or 6-month window. A single month's traffic number tells you very little. The trend tells you a story.
As of 2026, studies indicate that about 53% of all website traffic comes from organic search, and organic search remains the most sustainable source of traffic, particularly for long-term business growth.
What to show in the report: A month-over-month and year-over-year comparison of organic sessions, broken down by top landing pages.
2. Keyword Rankings (Tracked, Not Averaged)
Keyword rankings are one of the most misused metrics in SEO reporting. The problem is how they are usually presented. Showing an "average position" number is almost useless.
If you rank number one for a keyword with 10 monthly searches and number fifty for a keyword with 50,000 monthly searches, your average position might look decent, but you are getting crushed where it actually matters. The metric treats all keywords as equal when they are not.
Instead, track a core set of target keywords individually. Group them by intent: commercial, informational, and local. Show whether they moved up, down, or stayed the same. A rising trend in rankings for high-intent keywords is one of the clearest early signals that a campaign is working.
What to show in the report: A grouped table of tracked keywords with current position, previous position, and search volume. Flag big movers with a highlight.
3. Click-Through Rate (CTR)
Getting to page one is not the end goal. Getting the click is. CTR tells you the percentage of people who saw your listing in the search results and actually clicked on it.
In 2025, the click-through rate for position 1 on SERPs was 39.8%, followed by 18.7% for position 2, 10.2% for position 3, and 7.4% for position 4.
A page sitting at position 3 with a CTR of 2% is a red flag. It likely means your title tag and meta description are not doing their job. That is an insight you can act on immediately, which makes CTR one of the most practical metrics to include in any SEO report.
What to show in the report: Top pages by impressions with their CTR. Flag any pages where CTR is significantly below the benchmark for their ranking position.
4. Conversions from Organic Traffic
This is the metric that most SEO reports skip, and it is the one that clients care about the most.
Traffic volume alone no longer impresses sophisticated clients who understand that business results matter more than vanity metrics. Modern reporting emphasizes conversion quality and revenue attribution from organic search.
Whether your conversion is a phone call, a form fill, a product purchase, or a demo request, you need to show how much of that activity is coming from organic search. Google Analytics 4 makes this possible with goal tracking and attribution modeling.
When you can say "organic search drove 34% of your total conversions this month," that is a statement no client forgets.
What to show in the report: Conversions by source with organic search highlighted. If possible, attach a revenue value or average order value to organic conversions.
5. Core Web Vitals and Page Experience
This one lives at the intersection of technical SEO and user experience, and it deserves a spot in your regular reporting. Google uses Core Web Vitals, which include Largest Contentful Paint (LCP), Interaction to Next Paint (INP), and Cumulative Layout Shift (CLS), as part of its ranking signals.
Research from 2025 shows a clear correlation between Core Web Vitals performance and business outcomes: an LCP under 2.5 seconds leads to 15-25% higher conversion rates than slower sites, and an INP under 200ms delivers 20-30% better engagement metrics.
Most clients will not know what these acronyms mean, and that is fine. Your job is to translate them. "Your site loads faster than 78% of your competitors" is a version of this metric that anyone can understand and appreciate.
What to show in the report: A simple pass/fail or score for each Core Web Vital, plus the trend over the reporting period.
6. Backlink Profile (Quality Over Quantity)
Links from other websites remain one of the strongest signals Google uses to evaluate a site's authority. But the number of backlinks is far less important than the quality of those backlinks.
Authority metrics combine backlinks, referring domains, and link quality to show how your site stacks up against competitors. Tools such as Ahrefs and SEMrush can track backlinks, measure referring domains, and monitor domain authority.
A handful of links from well-respected, relevant websites is worth more than hundreds of links from low-quality directories. In your SEO report, show new links acquired, the domains those links came from, and any toxic links that were disavowed.
What to show in the report: New referring domains gained in the period, with a note on the quality or relevance of each. Highlight any editorial placements or earned media coverage.
7. Organic Revenue and ROI
For eCommerce businesses and any company that can tie revenue to web activity, this metric belongs at the top of the report, not buried at the bottom.
Reporting organic revenue requires proper GA4 setup with eCommerce tracking, but once it is in place, it changes the entire conversation with clients. You move from reporting effort to reporting outcomes.
For B2B companies, organic search generates 44.6% of all revenue. That is not traffic, that is revenue, and the next closest channel is not even close.
What to show in the report: Organic revenue for the period, compared to the previous period. If a direct revenue figure is not available, show the conversion value using estimated lead value.
Part 2: Metrics You Should Stop Including
This section is what most SEO reporting guides skip, and it may be the most valuable part of this article.
Drop: Bounce Rate as a Standalone Metric
Bounce rate, the percentage of sessions where a user left without clicking to another page, has been widely misunderstood for years. A high bounce rate on a contact page where people fill out a form and leave is perfectly normal. A high bounce rate on a product page is a problem. Without context, the number means nothing.
Google Analytics 4 has already moved away from traditional bounce rate in favor of "engagement rate," which is a more accurate reflection of whether users found value in a page.
Drop: Domain Authority as a Primary KPI
Domain Authority (DA) is a third-party metric created by Moz. It is a useful directional indicator, but it is not a Google ranking factor and it should not be treated like a target. Chasing a DA score can lead to low-quality link-building tactics that hurt rankings in the long run.
Nobody cares about your DA score. They care whether SEO drove growth. Make sure your metrics prove it.
Drop: Average Position as an Overall Score
As explained earlier, averaging your keyword positions produces a number that can look fine while the metrics that actually matter are headed in the wrong direction. Replace it with position data broken down by individual keyword groups.
Drop: Total Impressions Without CTR Context
Impressions mean your pages showed up in search results. That is it. Without CTR alongside it, impressions tell you nothing about whether those appearances led to any real activity.
Part 3: How to Actually Present an SEO Report
Getting the right metrics is half the battle. How you present them determines whether those metrics lead to action or get filed away and forgotten.
Lead With Business Goals, Not SEO Goals
Every report should open with a one-paragraph reminder of what the client is trying to achieve and a summary of how this period's results moved toward that goal. If the goal is more leads, your opening line should mention leads. Not rankings, not traffic, not impressions.
Use Visuals, But Not Just for the Sake of It
Research indicates visuals are processed 60,000 times faster than text, enhancing comprehension.
Line graphs work well for trends over time. Bar charts work for comparisons. Tables work when the client needs to see the specific data points. Use each for its purpose and keep them uncluttered. A chart with five competing data series and a tiny legend is harder to read than a simple table.
Tell a Story, Not a List
Think of your SEO report like a short narrative with three acts: what happened, why it happened, and what we are going to do about it. Clients are not looking for raw data. They are looking for a story that ends with a plan.
When reports connect insights to actions, client conversations shift from "what happened?" to "what should we do next?" and clear SEO reporting builds trust.
Automate the Data Collection, Not the Thinking
Tools like Google Looker Studio, AgencyAnalytics, and TapClicks can automatically pull data from Google Search Console, Google Analytics, and third-party SEO tools on a set schedule. This removes the manual work of exporting spreadsheets every month.
Automated SEO reporting removes those steps. Automated reporting tools pull data on a fixed schedule and refresh reports without manual updates. This matters even more if you manage multiple clients or locations.
But automated tools should handle data collection, not the analysis layer. The interpretation and the "so what" has to come from a real person who understands both the strategy and the client's business.
Structure Your Report in This Order
A practical SEO report structure that works across industries:
- Executive Summary (2-3 sentences connecting results to goals)
- Key Wins This Period (highlight the 2-3 biggest positive movements)
- Organic Traffic Trends (with YoY and MoM comparison)
- Keyword Rankings (grouped by intent, filtered to target terms)
- Conversions and Revenue from Organic (tied to business goals)
- Technical Health (Core Web Vitals, crawl issues flagged)
- Backlink Activity (new referring domains, editorial mentions)
- Challenges and Opportunities (honest assessment)
- Next Steps (3 specific actions for the coming period)
This structure keeps the report focused and ensures every section connects back to the client's goals.
Part 4: SEO Reporting in the Age of AI Search
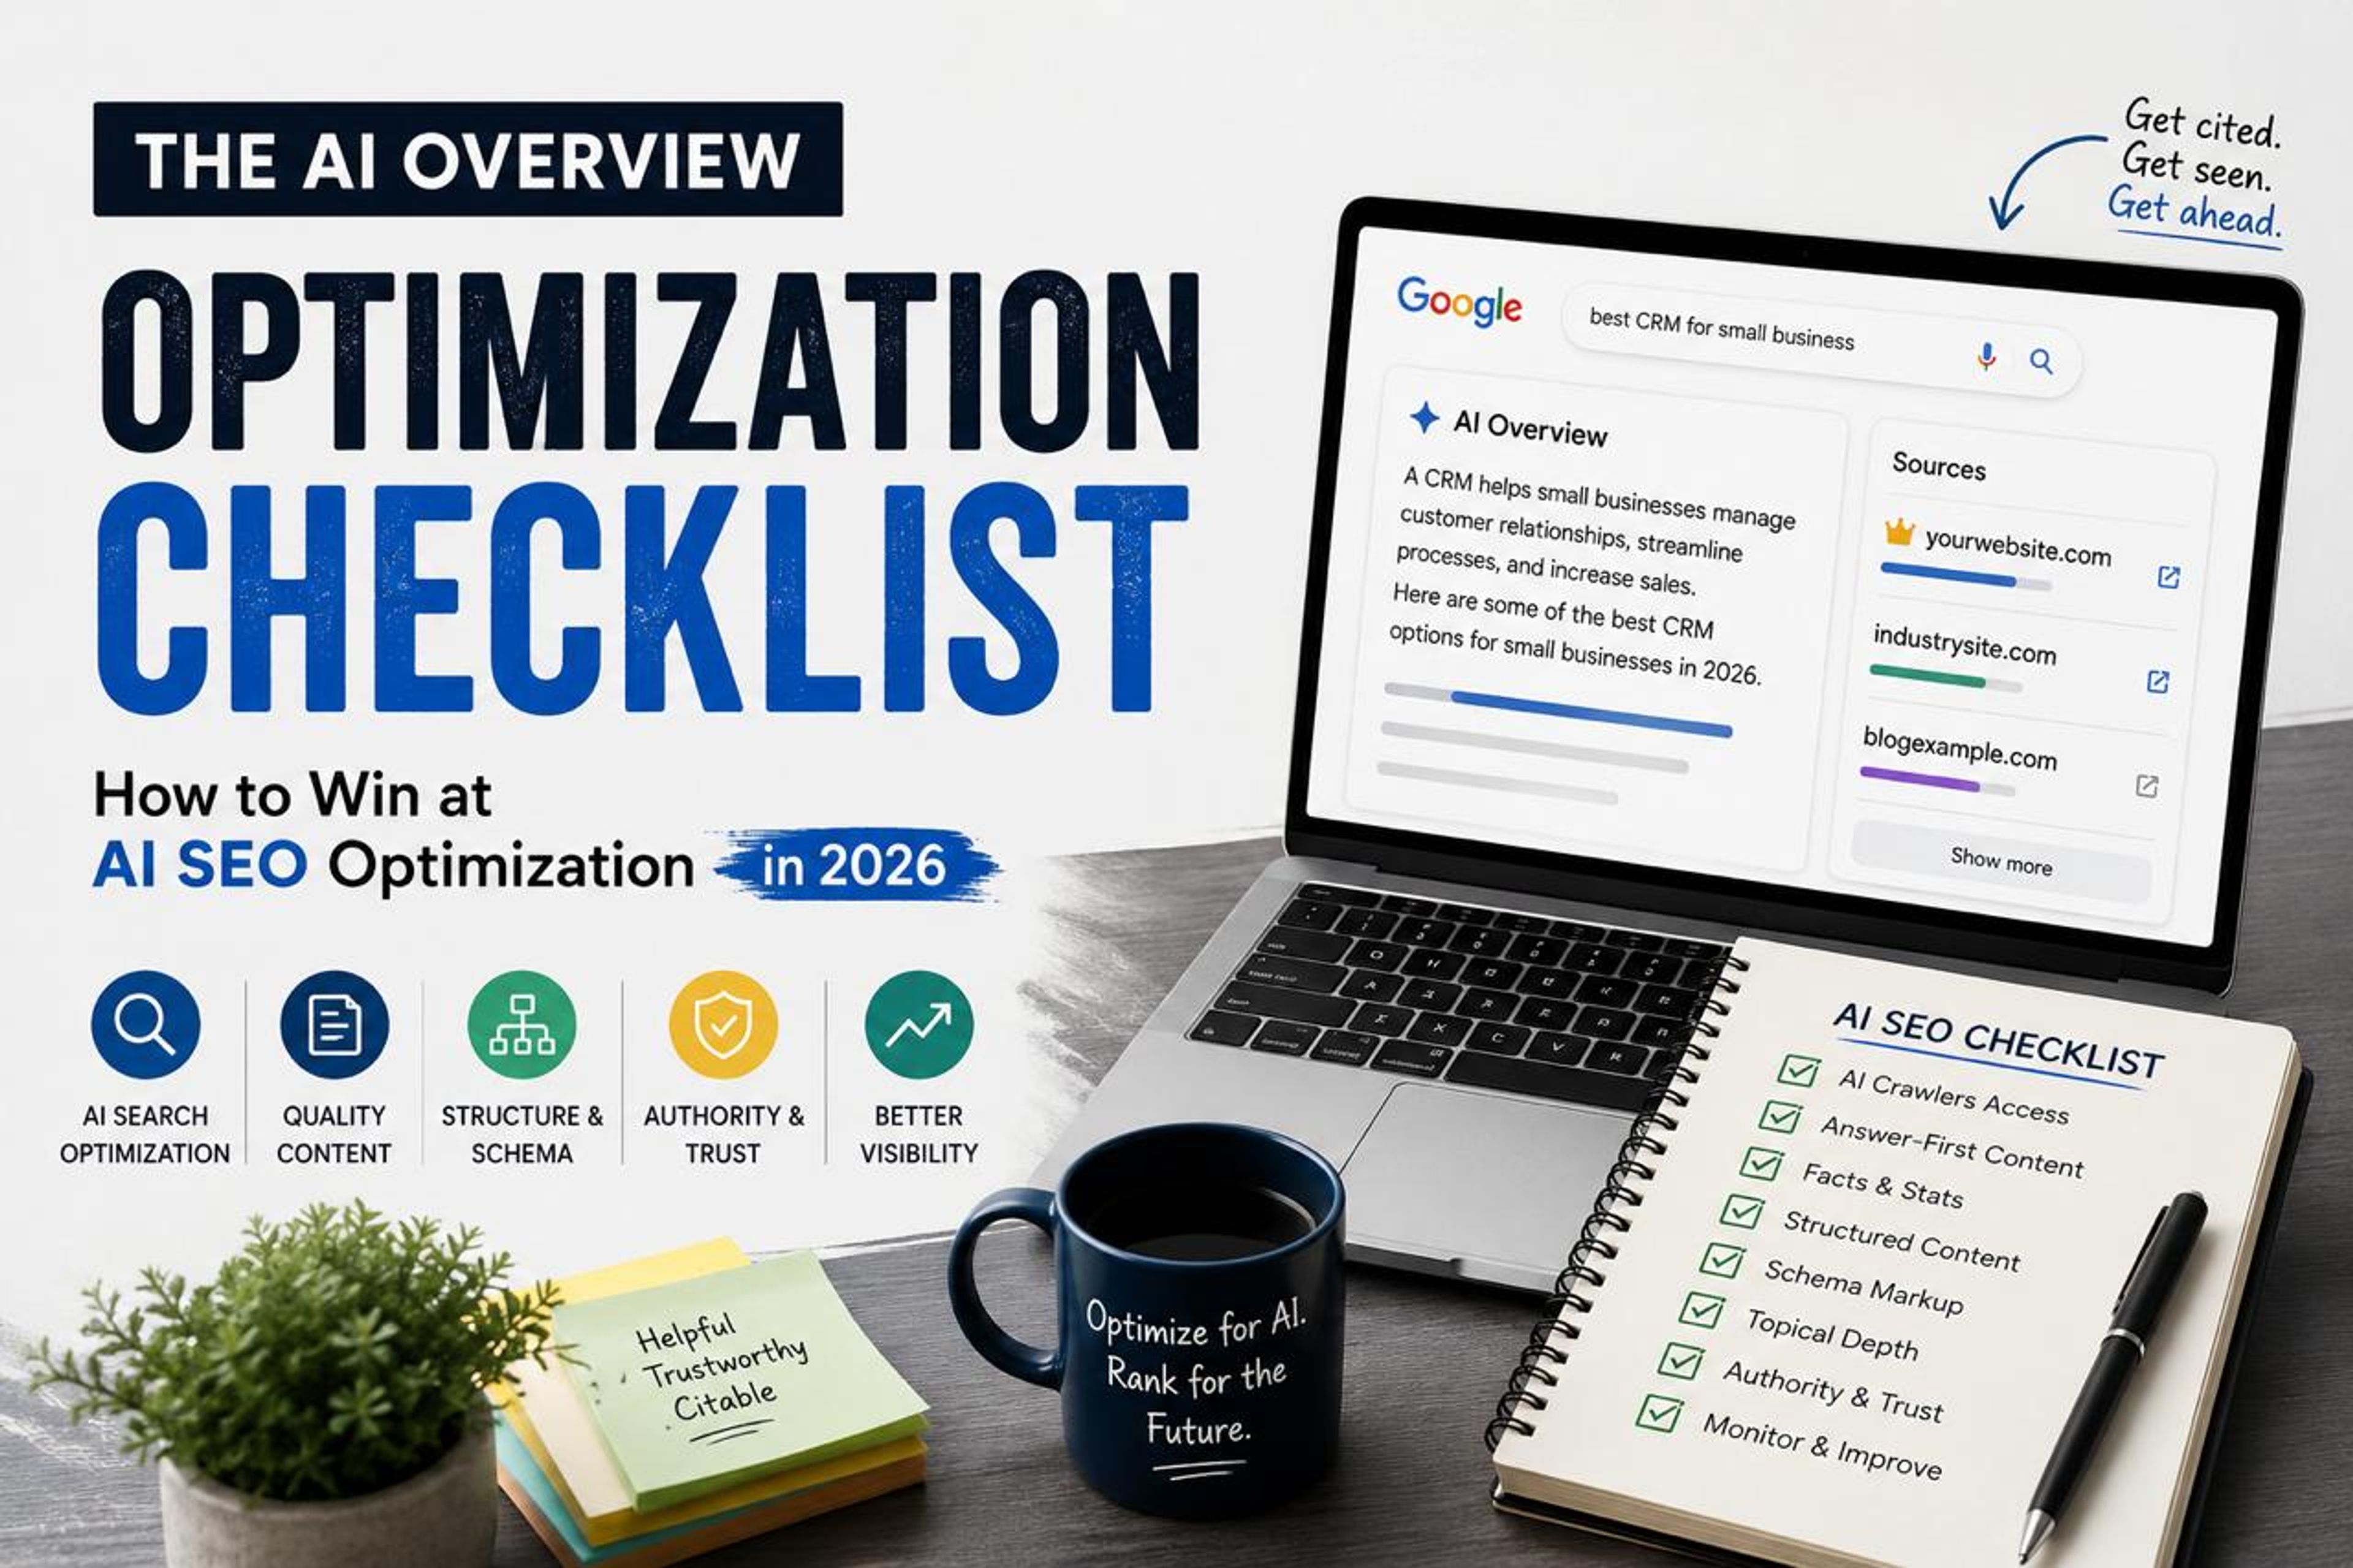
If you are not updating your SEO reporting to account for AI Overviews and generative search features, your reports are already slightly behind.
Google's AI Overviews now have 2 billion monthly users, up from 1.5 billion in May 2025.
This matters for reporting because clicks from traditional organic listings are changing. In Q1 2025, only 40.3% of US Google searchers clicked on an organic result, down from 44.2% the prior year. This means a flat or slightly declining organic traffic trend does not necessarily mean your SEO is getting worse. It may mean more people are getting answers directly in the SERP without clicking.
This is a new conversation to have with clients, and it needs to be part of your SEO reporting narrative. Start tracking your brand's visibility in AI Overviews, featured snippets, and People Also Ask boxes. These "zero-click" appearances still build brand awareness and authority even without a direct click.
AI Visibility, a measure of how often your brand is mentioned, cited, and recommended in AI surfaces like Google's AI Overview and ChatGPT, is now a metric that forward-looking SEO reports should include.
Teams working on Growth Optimization need to factor this into reporting frameworks now, not six months from now.
Part 5: SEO Reporting for Different Audiences
One report structure does not fit all audiences. Knowing who will read your report changes how you write it.
Reporting for Business Owners
Business owners want to know if they are getting their money's worth. Lead with revenue, conversions, and growth. Keep technical sections to a minimum and use plain language throughout. One page of key numbers with a brief narrative often works better than a ten-page breakdown.
Reporting for Marketing Directors
Marketing directors understand channel dynamics. They want to see how SEO performs relative to PPC Services, social, and email. Include competitive visibility data and show how organic search fits into the overall acquisition mix.
Reporting for Internal SEO Teams
SEO professionals want the technical detail. They need crawl reports, log file analysis, Core Web Vitals breakdowns, and backlink audits. This audience can handle full data exports alongside narrative summaries.
Part 6: Choosing the Right SEO Reporting Tools
You do not need an expensive stack to produce a great SEO report. Here is what a solid foundation looks like.
Google Search Console is non-negotiable. It gives you impressions, clicks, CTR, average position, and Core Web Vitals data directly from Google. It is free and accurate.
Google Analytics 4 handles traffic sources, conversion tracking, user behavior, and (for eCommerce) revenue attribution. Also free.
A rank tracker such as Ahrefs, SEMrush, or Moz adds depth by tracking keyword positions over time, monitoring backlink growth, and comparing your site against competitors.
A reporting layer such as Google Looker Studio or a white-label reporting tool pulls all of this together into a single client-facing view.
Businesses looking for a full-service approach can also work with a Video Services team to turn monthly SEO results into short summary videos, which is increasingly popular for clients who prefer video over written reports.
What the Top-Ranking Articles Are Missing
After reviewing the top results currently ranking in the US for "seo reporting," here are the gaps that most of them share:
Most articles tell you what to measure. Very few tell you what to stop measuring and why, which is equally important. This guide covered both.
Most guides focus on tools and templates. Few of them address how to communicate the narrative layer of an SEO report, the story behind the numbers. We covered that in Part 3.
Almost none of the top-ranking pieces address the AI search shift and how it affects what counts as a "result" in 2025 and beyond. We covered that in Part 4.
Very few articles segment reporting advice by audience type. A business owner and a marketing director need different reports, and that difference matters. Part 5 covered this.
These gaps are exactly why a properly structured SEO reporting process, built by an experienced SEO Company in India or in-house team, can move the needle in competitive industries where everyone is running the same standard metrics.
Building Trust Through Consistent Reporting
At the end of the day, SEO reporting is not just about data. It is about trust.
A client who understands their SEO results is a client who stays. A client who sees consistent improvement tied to clear business goals becomes an advocate. And a client who feels like their agency is transparent even when results are mixed is one who will follow your recommendations when the strategy needs to change.
SEO reporting is the process of collecting, analyzing, and presenting SEO performance data in a way that shows progress, explains results, and highlights opportunities. It bridges the gap between technical metrics and business outcomes, turning impressions and rankings into tangible ROI.
That definition should be the north star for every report your team produces. Not "here is everything that happened this month." But "here is what this means for your business, here is why it happened, and here is what we are going to do next."
Whether you are managing SEO services for a single client or running campaigns across a portfolio for a full-service Digital Marketing Agency, that principle holds true every single time.
Explore Services & Solutions
SEO Services Hub
Access our comprehensive vertical strategies, core processes, and expert resources.
View service hub Specialized SolutionEnterprise Technical SEO
Drive high-intent organic traffic with our advanced technical auditing and optimization frameworks.
Learn moreReady to grow your digital presence?
Connect with our execution specialists for a customized roadmap.